
The Anatomy of a Computable City: Visualizing Integrated Physical AI
We spend a lot of time discussing the theoretical potential of digital twins and algorithmic sustainability. But to truly understand how we are going to engineer our way out of the climate crisis, we have to look at the entire architectural stack simultaneously.
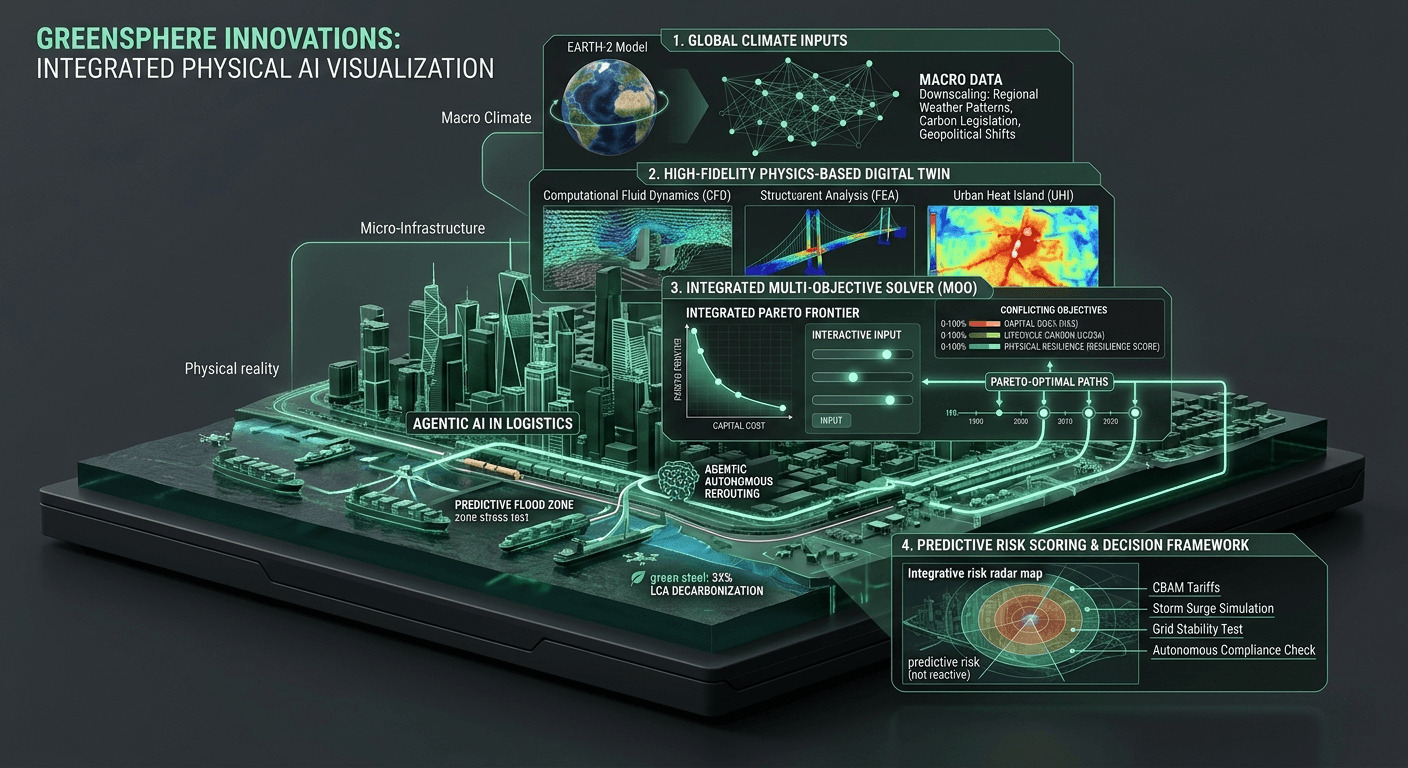
The visualization above represents the core of what we are building at GreenSphere Innovations: an Integrated Physical AI ecosystem. It is the blueprint for a "computable city"—a living, deterministic model where global atmospheric data physically interacts with local infrastructure and autonomous supply chains in absolute real-time.
Breaking down this visualization reveals why traditional, disconnected enterprise software is no longer sufficient for the built environment, and how systems engineering must evolve to handle the sheer mathematical complexity of a changing planet.
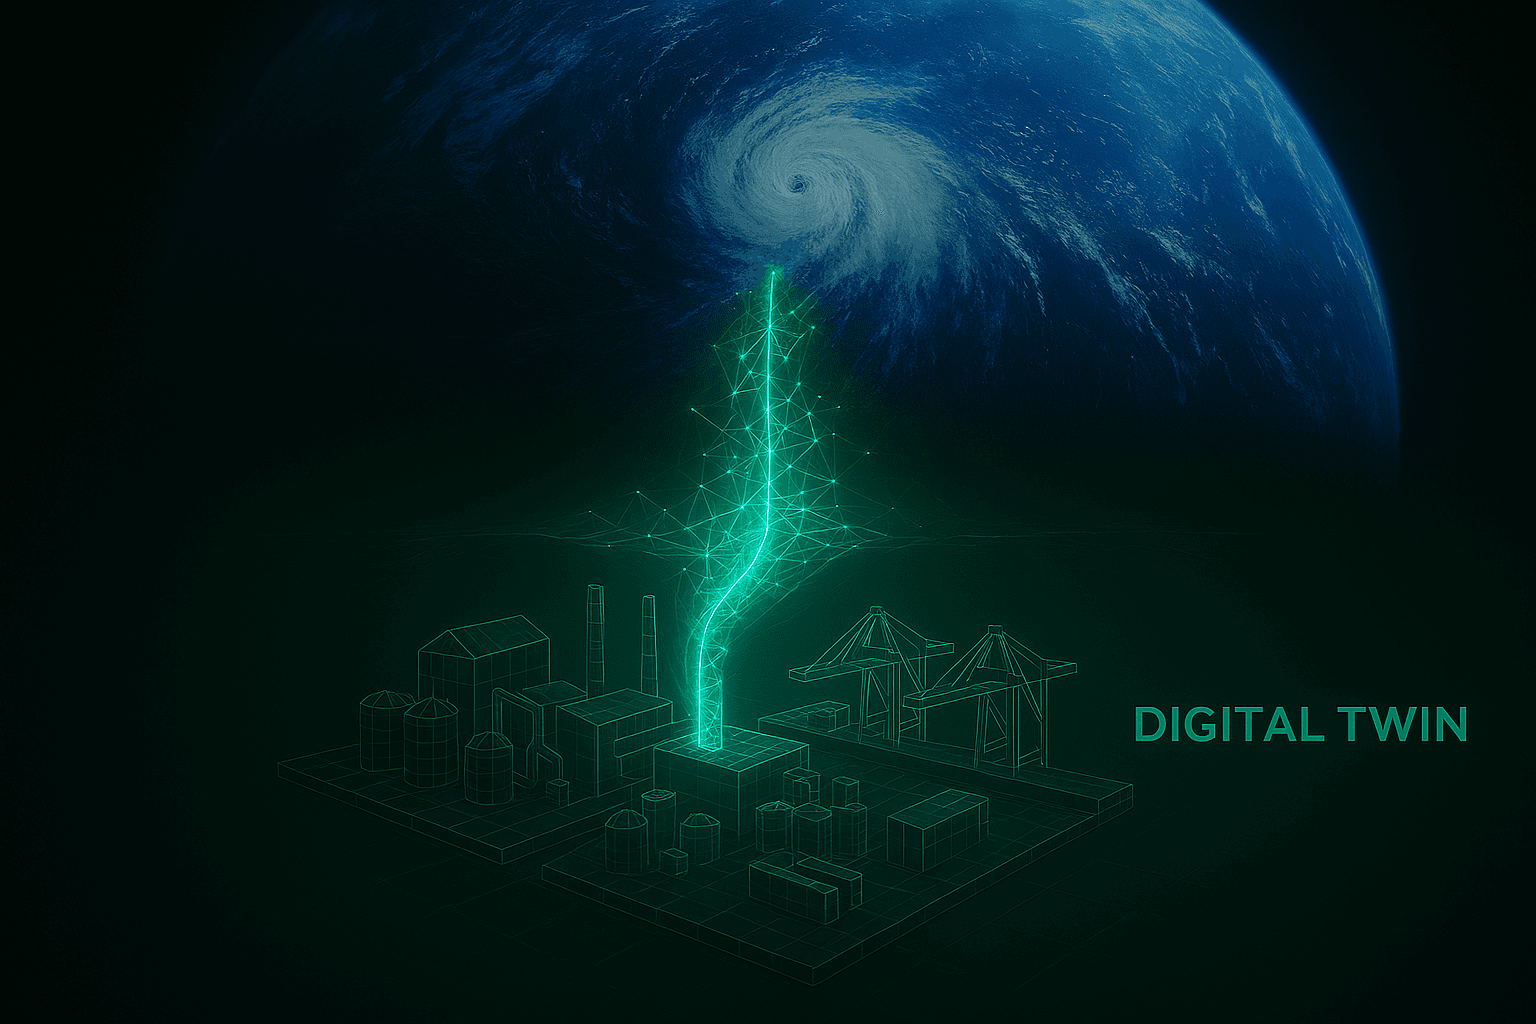
1. Global Climate Inputs: The Macro-to-Micro Pipeline
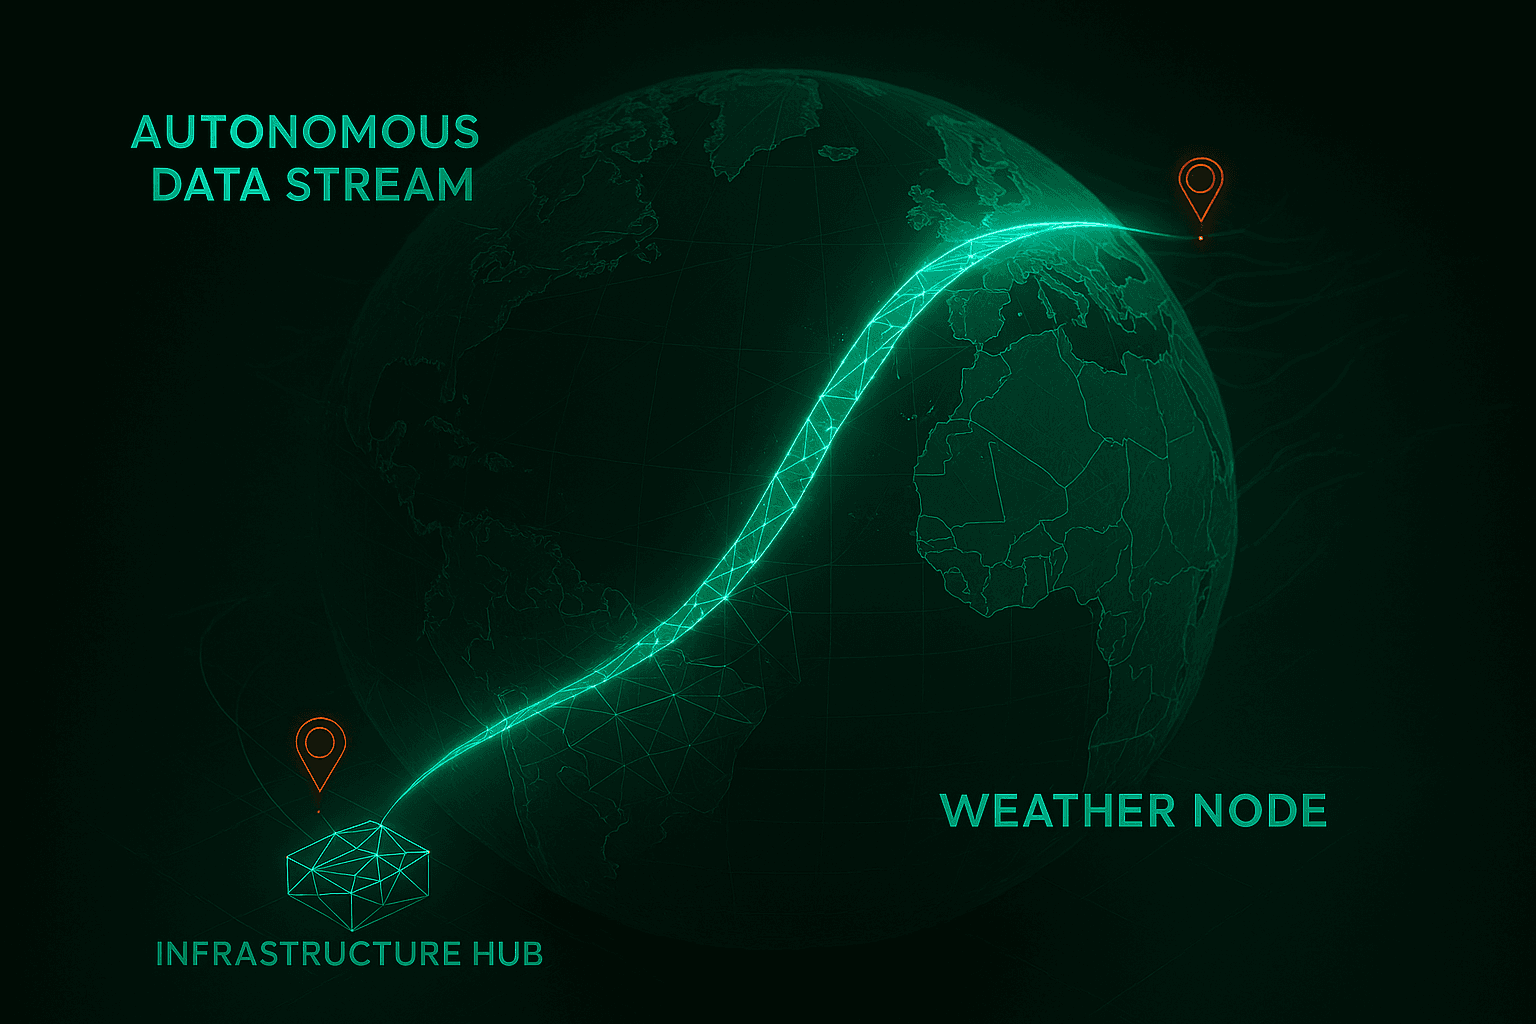
At the very top of the stack, we have the planetary view. Through integrations with advanced predictive models like NVIDIA's Earth-2, the system ingests massive, macro-level climate data—ranging from regional weather patterns and shifting geopolitical bottlenecks to incoming carbon legislation.
However, macro data is useless to a civil engineer unless it is downscaled. The system's first autonomous task is to funnel these planetary-scale inputs directly into the localized environment. If a global model predicts an unprecedented atmospheric river, the system instantly translates that massive weather front into localized, millimeter-scale physical force vectors.
2. High-Fidelity, Physics-Based Digital Twins
This is where the macro data hits the concrete. The visualization shows a deep green, highly detailed replica of an urban center and its surrounding industrial ports. This is not a static CAD drawing; it is a true physics-based digital twin.
When the downscaled climate data hits the city, the system concurrently runs multi-physics simulations. You can see Computational Fluid Dynamics (CFD) modeling the aerodynamic shear of extreme winds through the skyscraper corridors, Structural Analysis (FEA) testing the tensile limits of a suspension bridge, and Urban Heat Island (UHI) mapping exposing thermal vulnerabilities. The infrastructure is treated as a living thermodynamic organism, revealing exactly where physical failure will occur before a storm ever forms.
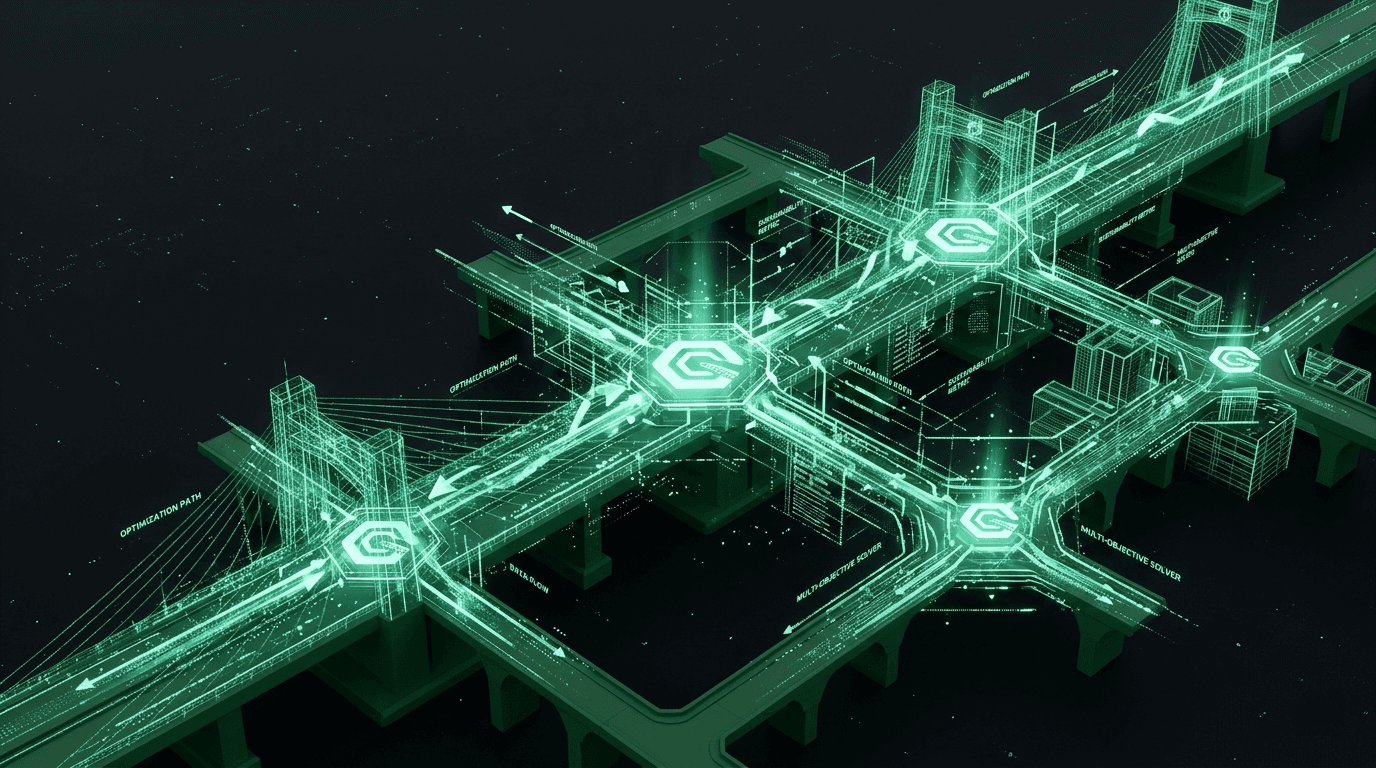
3. The Integrated Multi-Objective Solver (MOO) & Agentic Logistics
The center of the dashboard highlights the most critical engineering challenge in modern sustainability: conflicting goals. You cannot optimize a city or a supply chain for just one variable.
The Integrated Pareto Frontier graph visualizes the brutal tug-of-war between Capital Cost, Lifecycle Carbon (LCA), and Physical Resilience. By leveraging agentic engineering workflows, the system runs tens of thousands of iterations, allowing operators to interactively slide their constraints and immediately see the mathematically verified Pareto-optimal paths. It finds the exact point where we maximize safety and minimize carbon without bankrupting the project.
Simultaneously, this intelligence extends out to the water. The visualization shows Agentic AI actively managing logistics. When a "Predictive Flood Zone stress test" flashes red over a coastal terminal, autonomous agents instantly trigger "Agentic Autonomous Rerouting," calculating new freight paths that maintain delivery schedules and bypass the hazard, all while autonomously tracking the new Scope 3 emissions.
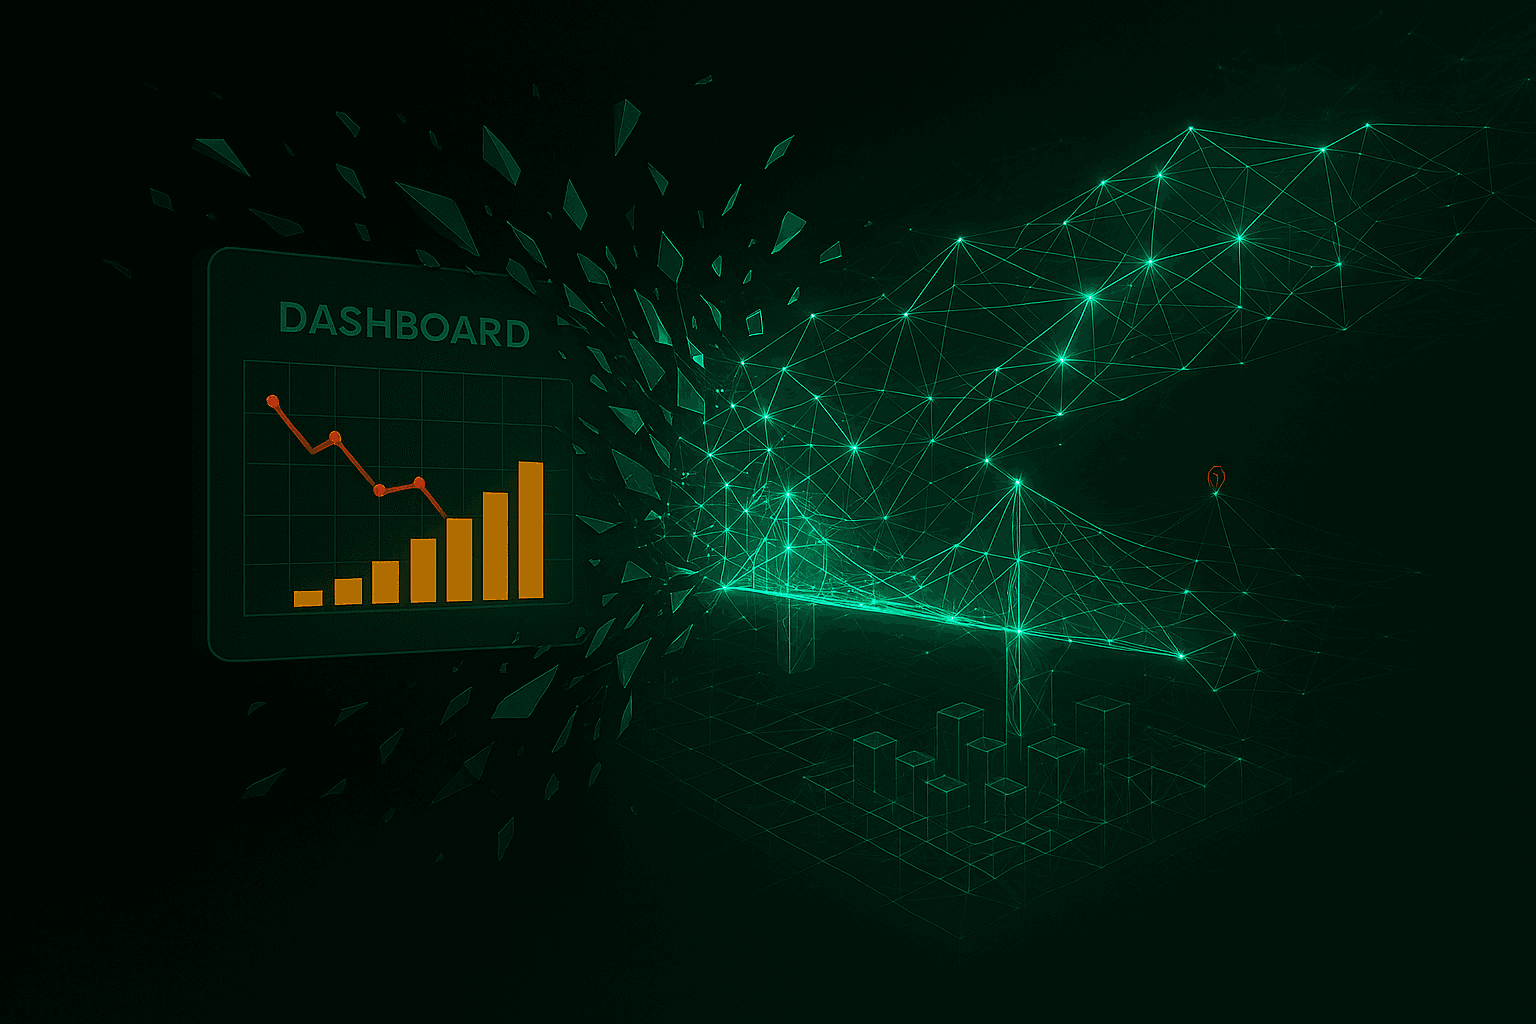
Predictive Risk Scoring & Decision Framework
Finally, all of this multi-physics and multi-objective data feeds into a unified risk radar. For decades, corporate ESG and infrastructure risk management have been reactive—a dashboard that flashes red after a failure or a fine occurs.
The GreenSphere framework flips this to proactive foresight. The system continuously runs autonomous compliance checks against upcoming CBAM (Carbon Border Adjustment Mechanism) tariffs, grid stability tests, and storm surge simulations. It does not just tell an enterprise what went wrong yesterday; it scores the exact financial and structural risk of what is going to happen next week, providing the exact engineering schematic needed to neutralize the threat today.
Engineering the Future
We can no longer afford to design cities and global supply chains in digital silos. The physical world is interconnected, and our computational tools must be as well. By unifying macro climate data, physics-based structural simulation, and agentic multi-objective solvers into a single cohesive architecture, we are moving beyond simply observing the climate crisis. We are giving the enterprise the power to actively engineer a hyper-resilient, mathematically optimized future.